Tuesday, January 31, 2012

Wireless Customer Satisfaction Doesn't Prevent Customer Churn

The conventional wisdom for most people, including executives at mobile service provider companies, is that there is a relatively direct relationship between "customer satisfaction" and customer churn. In other words, "happy customers" don't leave.

It doesn't appear that is the case. Perhaps perversely, even happy customers will churn (leave a supplier for another), and at surprisingly high rates.
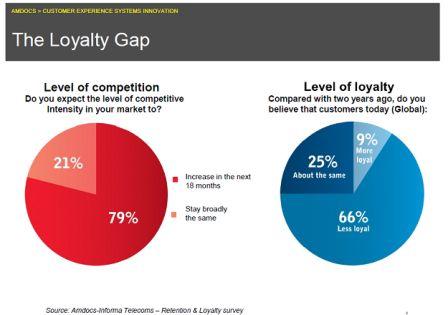
Two out of three (66 percent) wireless and cable TV consumers switched companies in 2011, even as their satisfaction with the services provided by those companies rose, according to Accenture.

The paradox is that “customer satisfaction” does not lead to “loyalty.” Also, there are new precursors to churn, especially the growing pattern of consumers adding a second provider of a service, without dropping the original provider. That of course puts a potential full replacement provider into a relationship with a consumer.

The Accenture Global Consumer Survey asked consumers in 27 countries to evaluate 10 industries on issues ranging from service expectations and purchasing intentions to loyalty, satisfaction and switching.

Among the 10,000 consumers who responded, the proportion of those who switched companies for any reason between 2010 and 2011 rose in eight of the 10 industries included in the survey.

Wireless phone, cable and gas/electric utilities providers each experienced the greatest increase in consumer switching, moving higher by five percentage points.

According to the survey, customer switching also increased by four percent in 2011 in the wireline phone and Internet service sectors.

There is a new and apparently growing indicator of churn potential as well. In a growing percentage of cases, consumers are adding new providers, instead of switching entirely. That can disguise the danger of churn, as the original provider does not realize a new potential replacement provider also has established a relationship with a particular consumer.


“Companies are improving many of the most frustrating parts of the customer service experience, but they are facing a customer who is increasingly willing to engage multiple providers for a service and is apt to switch quickly,” said Robert Wollan, global managing director, Accenture Customer Relationship Management. “

Note the contradiction here: consumers were “more satisfied” and also “not loyal” because of that satisfaction.

Consumers reported increased satisfaction across each of 10 service characteristics evaluated. In fact, satisfaction rates on three customer service characteristics jumped by more than five percentage points from 2010.

However, only one in four consumers feels “very loyal” to his or her providers across industries, and just as many profess no loyalty at all. Furthermore, two-thirds of consumers switched providers in at least one industry in the past year due to poor customer service.

In emerging markets, these contradictions are even more pronounced. While consumers there reported greater customer satisfaction than their mature-market peers, they more often switched providers due to poor service across all industries (in some cases by a two-to-one ratio over mature markets), especially within the retail, ISP, mobile and banking industries.


User Experience on PCs, Tablets, Smart Phones Differs Vastly

Latency is getting to be a bigger deal for mobile user experience. Apps that load quickly on a PC take much longer to load on a smart phone or tablet, Yankee Group reports, using Keynote Systems data.

Also, according to Yankee Group analyst Carl Howe, typical users now carry as many as five different mobile devices. But each of those devices might be optimized in different ways, in terms of latency.

Load times among sites differ because in most cases, content owners are not customizing the content they deliver to the device, says Howe. The majority of the sites Keynote Systems monitored, including major online brands Craigslist and Apple, sent the same content to smart phones and tablets, for example.

Facebook, Bing, Kayak, MSN, Amazon and IMDB all sent significantly more objects and bytes to tablets than to smart phones. These sites detected the larger screens of tablets and sent them more information, says Howe.

The one company that behaves significantly differently is Google, which sent roughly 450 KBytes to smart phones while sending only about 200 KBytes to tablets.

Google chooses to add several location-based options such as “Restaurants” and “Coffee” to smart phone content but doesn’t serve up those features to tablet users, probably because many tablets don’t offer location services by default. As a result, smart phones receive more content from Google than tablets do.

Those findings are interesting for several reasons. Since different devices feature different screen sizes and input and output capabilities, get used in different ways, at different locations, at different times of day, customizing the experience makes sense.

But tailoring a user experience based on what device is used, when it used or where it is used is not so different from tailoring an experience based on what application a user wants to engage with. And that’s where legitimate concerns about unfair business advantage bump up against end user preferences.

When a user wants to watch a video, conduct a video call or play an interactive game, issues such as latency and consistency of bandwidth availability are important performance parameters.

The policy issue is whether users or service providers ought to be able to manage network experience to enhance end user experience. For such reasons, some think “best effort only” access is not optimal.


Some 21 percent of surveyed enterprise information workers are using one or more Apple products for work, Forrester Research says.

Almost half of enterprises (1000 employees or more) are issuing Macs to at least some employees and they plan a 52 percent increase in the number of Macs they issue in 2012.

Managers and executives are more than twice as likely to use Apple products, suggesting an adoption pattern where the ability to use the device is something of a “perquisite,” much as at one time the ability to use a BlackBerry was a perquisite for enterprise executives.

But younger information workers (IT staffs for example) are twice as likely to use Apple products as older ones.

Higher income workers are more likely to use Apple products as well, but there is a “younger worker” issue here. Most of the sample of 10,000 global information workers earns less than $50,000 a year, but the adoption rate of Apple products is almost 17 percent even in the bottom quartile of workers who make less than $12,000 per year.

Keep in mind, also, that the survey was global in scope, and Information workers in countries outside North America and Europe were more likely to use Apple products for work. Annual salaries also might tend to be lower in non-European and North American settings.


Where click through rates are concerned, screen size matters. Simply put, larger screens tend to get higher click through rates, and some devices tend to have higher engagement than others. Smart phone screens tend to get click throughs at about a two-percent to four-percent rate.

Larger tablet screens such as those sported by the Apple iPad or Samsung Galazy get CTRs of about nine percent. The results are generally similar across device brands.

Telecom Finally Has its "Fashion" Moment: But Apple Owns It


When Apple set out to revolutionize the phone handset business, it might not have foreseen precisely how much change it would cause.

Not the least of the changes is a shift of power within the retail business, as mobile service providers for the first time have lost the ability to dictate what devices users can use, and what features devices should provide.
On the other hand, some of us have argued that the key marketing problem for any telecom service provider always has been that nobody really "loves" their service provider, and identifies with the service, in the same way that people routinely identify with their autos, clothing, perfumes, shoes, hobbies or sports.
What telecom has needed, in that vein, is a way to create, for consumers, that high emotional bond.
Apple's iPhones have become that bond, for the first time in the industry's history.
Of course, there is a bit of a downside: the emotional bond is with the device, created by Apple, still not the service. But the change is significant. The Apple iPhone now personifies the value of the communications connection. But other changes, for handset suppliers, would seem to be coming.

The reason is that handset
profitability, more than anything else, now is shaping the global smart phone business, one might argue.

Globally, Apple and Samsung have, over the last 12 months, surged to the top of the charts in terms of smart phone sales volume, according to Strategy Analytics.

In the past, the “smart phone” category has not been significant, as all devices were feature phones or basic phones.

As the market begins to shift to a smart phone buyer pattern, differences in firm strategy and execution have lead to a rapid change in market leadership.

Global smart phone shipments grew 54 percent annually to reach a record 155 million units in the fourth quarter of  2011, according to Alex Spektor, Strategy Analytics associate director. That apparently has proven to be a decisive change.

In the past, Nokia has been the global share leader, but Nokia has not been able to translate that prior success into smart phone success, where Apple has changed the game and Samsung apparently has been able to keep pace.

Apple overtook Samsung to become the world’s largest smartphone vendor by volume with 24 percent market share. Apple’s global smartphone shipments surged 128 percent annually to 37.0 million units, as distribution of the iPhone family expanded across numerous countries, dozens of operators and multiple price points.”

Apple took the top spot for share on a quarterly basis, but Samsung became the market leader in annual terms for the first time with 20 percent global share during 2011. With global smartphone shipments nearing half a billion units in 2011, Samsung is now well positioned alongside Apple in a two-horse race at the forefront of one of the world’s largest and most valuable consumer electronics markets, Strategy Analytics says.

In contrast, Nokia’s smart phone market share was cut in half from 2011 to 2011, dropping from 33 percent in 2010 to 16 percent in 2011.

That is one reason there has been so much focus on the Nokia partnership with Microsoft, as many would argue the Windows Mobile operating system represents the best shot Nokia will have to avoid collapse.

The other observation of note would be that profitability might now be emerging as the key differentiator, even though design and consumer demand clearly are driving the market overall.

Samsung’s most-recent quarterly earnings also set records. Samsung Electronics Co declared $4.7 billion in quarterly operating profit. jumping 76 percent year over year.

Between them, Apple and Samsung earned fully 81 percent of all profits in the mobile handset business. 

Apple in the fourth quarter of 2011 shipped 37 million smart phones worldwide, up 117 percent from 17 million in the second quarter. This represented the strongest sequential quarterly growth among the top-five smart phone brands, according to IHS ISuppli.

“Samsung advanced in 2011 because of its strategy of offering a complete line of smartphone products, spanning a variety of price points, features and operating systems,” says Wayne Lam, IHS senior analyst.

On the other hand, the market share battle between Apple and Samsung reflects the competition between the two leading smartphone operating systems and ecosystems: Apple's iOS and Google's Android, says Lam.

“The relatively small growth of Sony Ericsson and Motorola may indicate that the Android smart phone market is becoming too crowded as the various licensees compete for limited consumer mind share and shelf space,” Lam says.
 

Aside from the obvious potential implication that there simply is not room in the global smart phone business for more than a few providers, the value of particular handsets, and their suppliers, seems destined to grow. 

People increasingly want, not so much the ability to use mobile communications, but iconic devices that use the networks. A hundred years ago, that was not the case. People just wanted the service. 

These days, the service is a feature of what has become a "fashion" item; a statement about values and lifestyle. At long last, the industry has managed to create high emotional involvement. As it turns out, though, the involvement is with the iconic devices, not the services. 

Tablets appear to be the next connected device to make that leap.


Global Telco "Meltdown" Coming? Or Just Normal Product Substitution?

BSkyB has been a major player in the United Kingdom subscription TV market for decades. But BSkyB faces a maturation of its base business, as do all other video entertainment and communications providers in Europe, North America and elsewhere.

 “The company made a number of announcements which confirm that, beyond the near term slowdown, structural issues are looming,” Bernstein analyst Claudio Aspesi argues.

“While we believe the pay TV business is inherently more defensive than advertising-funded ones, the depth and length of the downturn in the U.K. economy are still unknown: any significant changes to our forecasts for the UK TV ad market could be large enough to change the outlook for the stock.”

Structural change is another way of saying that saturated markets and greater amounts of competition are eroding the growth potential for virtually all big communications or entertainment businesses.

According to analysts at Ovum, global service provider revenues grew seven percent in 2011. On a global basis, service provider revenues will grow at a compound annual growth rate of 2.9 percent over the 2010-2017 period, down from the historic CAGR of 6.3 percent achieved in 2004 to 2010, according to analysts at Ovum.

The Ovum forecast shows the deceleration of revenue, even despite newer products such as mobile broadband.


A key strategic issue is whether service providers can grow new lines of business fast enough to offset lost revenues from their legacy businesses.

Most executives are familiar with the notion of a “product life cycle.” What might be a more provocative idea is the notion that collectively, the global communications industry might be entering a period where communications  itself hits something of a industry life cycle peak.

“The telco voice and messaging business is on the verge of going into meltdown,” muses industry consultant Martin Geddes. By that line of thinking, so much revenue and profit is about to be drained away that the replacement revenue streams (based largely on broadband access for the near term) cannot prevent some significant shrinkage of the overall business.

One doesn’t have to agree with all elements of the analysis to sense the danger. In some markets where the leading edge of the trend seems to be emerging (Europe), there is a palpable sense that voice and messaging revenues are about to become over the top apps, with an implied hit to the dominant provider revenue streams.

“I strongly believe the business model for voice and messaging is about to go into reverse,” says Geddes. “The value is going to drain out of minutes and messages charged to users.”

Many would agree with the fundamental challenges, without necessarily agreeing on the timing and magnitude of the revenue changes. In the near term, most also would agree that commercial services are the important new revenue driver for cable companies, while mobile broadband drives telco growth.

At some point, even those growth drivers will slow, which is why telco executives are working on new initiatives in cloud computing, machine-to-machine services and mobile commerce. The key issue is whether those, or other services not yet on the horizon, are big enough to offset the huge potential telco losses in voice and messaging and video losses for cable operators.

Strong Tablet Adoption Changes Device Behavior


That shipments of tablets are expected to grow from 72.7 million units in 2011 to 383.3 million units by 2017, according to NPD, would not surprise many observers.

Growth in emerging markets, expected to account for up to 46 percent of worldwide shipments by 2017, an increase from the 36 percent share in 2011, might be more surprising.

The tablet forecast also illustrates an important change in connected appliance trends. In the past, “PCs” have been one category of appliances, while MP-3 players, phones and digital organizers, game devices, cameras and e-reading devices have been distinctly different categories.

These days, many of those devices have overlapping functions. Taken as a whole, the changes suggest the crucial role “content consumption” now plays as a lead application for most devices. Though PCs, cameras and organizers still largely have “work or business” use cases, virtually all the other devices are oriented around content consumption.

If results of a U.K. consumer poll are any indication, tablet PCs are about to change Web browsing, gaming and reading preferences.

According to survey conducted by Cooper Murphy Webb, Apple’s iPad is the preferred method of reading newspapers and magazines among consumers already owning the device. Tablets change behavior

The poll also found that a plurality of iPad owners prefer the device for reading books and gaming. Perhaps surprisingly, respondents indicated they used their dedicated gaming consoles and iPads about equally when gaming. If that holds up, it could mean trouble for game console suppliers.

And a significant percentage prefer the iPad for Web browsing as well. That finding is less surprising, if one assumes the tablet device is designed to be used as a content consumption device.


Worldwide Tablet PC Emerging vs. Mature Market Shipment Forecast Breakout

No Surprise: Internet Value is at App Layer


A new Boston Consulting Group perspective piece about the inescapable role of the Internet in economic life raises obvious questions about where value now lies, as “every business needs to “go digital.”

By 2016, there will be three billion Internet users globally, and the Internet economy will reach $4.2 trillion in the G-20 nations, BCG argues.

“No company or country can afford to ignore this phenomenon,” BCG says. But that doesn’t mean every part of the ecosystem benefits equally, one might argue.

On one hand, a trillion devices will need to be connected to the Internet, which obviously implies the need for access services. Many of those devices will be sensors, which is why mobile service providers see such potential for machine-to-machine services.

But the business now is “about ecosystems,” BCG says. “The Internet is increasingly being shaped by ecosystems orchestrated by companies such as Amazon, Apple, Facebook, and Google, Baidu, Tencent and Yandex, BCG argues. .


And that is the concern service providers have, generally expressed as the fear of being reduced to a “dumb pipe” provider in a business where most of the value gets created elsewhere in the ecosystem. But it is hard to argue with the fundamental underlying logic.

Across the G-20 nations, the Internet economy amounted to 4.1 percent of GDP, or $2.3 trillion, in 2010 and is contributing up to eight percent of gross domestic product. So when service providers ask “Where is the value in the Internet ecosystem?” they often don’t like the answers.

The BCG shows one element of the concern, namely that even in the “access” business, value has shifted from fixed line to mobile. 


BCG argues that all contestants need to understand and strengthen their “digital balance sheets” to succeed.


The Internet also conveys sizable economic benefits that do not get captured directly by calculations of GDP. In the G-20 nations in 2010, consumers researched online but purchased offline more than $1.3 trillion in goods, the equivalent of about 7.8 percent of consumer spending in those nations.


In addition, in many leading G-20 nations, the Internet generated a consumer surplus of about four percent of GDP. This consumer surplus is the value that consumers place on the Internet above what they pay for it in device, application, and access costs.


Further economic benefits include business-to-business e-commerce and collaboration within and across companies, for example.


The good news is that demand for access services now is ubiquitous. By 2016, the three billion Internet users will represent 45 percent of the world’s population. But, by 2016, mobile devices will account for about 80 percent of all broadband connections in the G-20 nations.


Of course, much of the growth is happening in emerging markets rather than developed markets. The Internet economy of China will approach the size of the U.S. Internet economy in 2016.

Social media have taken hold everywhere, especially in emerging markets. That, of course, drives value for application providers, though indirectly for access providers.


Indonesia has the second-largest number of Facebook users. More than 90 percent of Internet users in Argentina, Brazil, and Mexico participate in social media, a higher percentage than in any developed nation.


Across all nations, social media are responsible for most of the new time spent on the Internet, including 22 percent of total Internet minutes. At the same time, social communications are starting to displace email, another historic reason for use of Internet access services.


And change is not likely to stop. As recently as 2005, the broadband access business was almost exclusively a “fixed network business.” That won’t be the case in the future.


The bigger problem remains that much of the new created value happens at the application layer.

But even within the “access” business, revenue sources are changing. Time Warner Cable fourth quarter 2011 earnings show that broadband and other new services now are the revenue driver for cable and telecom providers.


Broadband revenue grew to $4.4  billion, a 8.6 percent increase over 2010. Commercial revenues grew 32.7 percent increase to reach $1.4 billion. 


By way of contrast, Time Warner Cable lost 53,000 basic video subscribers, despite adding 79,000 net new customers from acquired cable firms.


In other words, actual losses were more on the order of 129,000 customers. In the fourth quarter of 2010, Time Warner Cable lost 141,000 basic video subscribers. For the full year, the cable company lost 453,000 video subscribers.


But Time Warner Cable gained 117,000 broadband subscribers in the fourth quarter, up 31.4 percent from the previous quarter and up 40 per cent from the fourth quarter of  2010. For the year, TWC gained 437,000 broadband subscribers. The cable giant also gained 133,000 residential digital voice subscribers for the year.

Those results, along with declining voice customers at AT&T, Verizon and most other fixed line telecom companies, show that specific communications services are products like any other.

Most executives are familiar with the notion of a “product life cycle.” What might be a more provocative idea is the notion that collectively, the global communications industry might be entering a period where communications  itself hits something of a industry life cycle peak.


“The telco voice and messaging business is on the verge of going into meltdown,” muses industry consultant Martin Geddes. By that line of thinking, so much revenue and profit is about to be drained away that the replacement revenue streams (based largely on broadband access for the near term) cannot prevent some significant shrinkage of the overall business.


One doesn’t have to agree with all elements of the analysis to sense the danger. In some markets where the leading edge of the trend seems to be emerging (Europe), there is a palpable sense that voice and messaging revenues are about to become over the top apps, with an implied hit to the dominant provider revenue streams.


“I strongly believe the business model for voice and messaging is about to go into reverse,” says Geddes. “The value is going to drain out of minutes and messages charged to users.”


Many would agree with the fundamental challenges, without necessarily agreeing on the timing and magnitude of the revenue changes. In the near term, most also would agree that commercial services are the important new revenue driver for cable companies, while mobile broadband drives telco growth.


At some point, even those growth drivers will slow, which is why telco executives are working on new initiatives in cloud computing, machine-to-machine services and mobile commerce. The key issue is whether those, or other services not yet on the horizon, are big enough to offset the huge potential telco losses in voice and messaging and video losses for cable operators.

Monday, January 30, 2012

Can Broadband Access be Segmented and Differentiated?

MetroPCS is among the few U.S. mobile operators that have embraced the idea of application-based charging, at least to the extent of offering plans aimed at light video consumers, heavy video consumers, and those in between.


Though it remains unclear precisely which new charging systems might gain favor, a survey of some 30 tier one service providers, sponsored by Tekelec and conducted by Heavy Reading, suggests several approaches are being considered.

Though the emphasis has been on simplicity and buckets of usage, there has been a change in thinking over the last two years, about the necessity of using differentiated charging mechanisms and plans to better manage and “monetize” mobile networks, in particular, says Mark Ventimiglia, Tekelec director.

“Usage problems and average revenue per user” are the main drivers of the new thinking, says Ventimiglia. But operating cost reduction also is part of the new thinking, especially as the dominant mobile service providers increasingly face upstart competitors willing to underprice existing tariffs.

“The higher end carriers can’t compete with ‘Free’ in France, for example, without innovating,” says Ventimiglia. Indeed, one has seen over the last decade an increase in segmentation in the French fixed network broadband business.

“Tunable networks” is one way to look at what marketing staffs want to create. But service providers also want simplicity, so consumes have clear value propositions and customer service personnel have an easier job supporting those offers.


The good news is that some marketing offers that might be more complex are not necessarily more complex “in the network,” says Ventimiglia. Lots of differentiated retail plans can be created that do not impose a new burden in terms of network managment complexity.

Some might say that if mobile or fixed network access providers do not want to be known as “dumb pipe” providers, then they just have to stop acting that way. And one way to do that is to tailor retail plans.

Even toothpaste and mouthwash now are sold to market segments with different lead values. There is no reason, in principle, why broadband access plans cannot be segmented the same way.

In any industry long accustomed to “usage-based billing,” it will come as no surprise that bandwidth caps prompt thinking about ways to offer temporary “overage protection,” for a fee.

More controversially, executives also are looking at application-based tiers, where customers pay based on the types of applications they want to use. Highly bandwidth intensive apps such as entertainment video or gaming might have one rate and usage quota, while email access and light web surfing might be billed at a different rate.

Plans that are optimized for social networking are another example of how retail plans can be tailored for users with different app profiles.

Speed-based tiers are common in the fixed line business, but might also find application in the mobile realm. Aside from different rates for faster and slower access, users might be offered various types of “speed boost” offers for users who only occasionally need high speed access, but most of the time can get by just fine with slower speeds.

Time-based tiers might charge more at peak hours and less at off-peak hours.

Family data plans of the sort now used for voice and messaging for multiple users and devices on a single account also are likely, allowing users on a single account to use multiple devices that share a single bucket of broadband usage.

One example might be a plan that supports each device with enough bandwidth to view 20 videos a month, with unlimited social networking and web browsing, and 200 hours of voice over Internet protocol calls per month, the study suggests.

In other cases, service providers might look at ways to create plans with “top ups” or “roll over” features on such family plans.

“Casual plans” that are easy to start and stop are another area where charging could change.

Services might mimic the out of home “hotspot” charging method, where users would be able to buy access for a day, for example.

Loyalty mechanisms also might be more common in the future, including birthday and service anniversary bonuses, free service top-ups twice a year, speed boosts, unlimited bandwidth during off-peak hours, or an extra five Gbps of data for six months with the purchase of a new tablet.

Special promotions to accelerate the adoption of new services or encourage
different mobile usage patterns might include unlimited access to a new application for three months, funded by advertisements, discounts on service tier upgrades, or unlimited services at certain times or days when the network is not congested.

Service providers might also want to “zero rate” some apps, while charging a premium for apps that require more bandwidth or will operate at peak hours.

ESPN Goes Mobile First

You'd expect ESPN Mobile to emphasize mobile content. But the more-important change would be if all of ESPN had that same perspective. It might be a bit early to say that has happened, but there is little doubt thinking is changing.

The thinking at ESPN is to "program and design from the mobile standpoint first, then extrapolate what could be applied for the PC, television and print experience,” says Michael Bayle, ESPN Mobile VP. Mobile First at ESPN 

That is a shift of perspective.

50% of Adults Used Mobiles In-Store While Shopping

More than half of all adult mobile phone owners used their devices for some shopping-related purpose during the last while they were in a store Christmas and holiday shopping season, the Pew Research Center reports.

Some 38 percent of mobile phone owners used their phone to call a friend while they were in a store for advice about a purchase they were considering making. Some 24 percent of mobile device owners used their phone to look up reviews of a product online while they were in a store. The rise of in-store mobile commerce

Some 25 percent of adult mobile owners used their phones to look up the price of a product online while they were in a store, to see if they could get a better price somewhere else. That is the aspect of mobile in-store shopping that seems to worry most brick and mortar retailers.

Taken together, just over half (52 percent) of all adult mobile phone owners used their phone for at least one of these three reasons over the Christmas and holiday shopping season and one third (33 percent) used their phone specifically for online information while inside a physical store, either to check product reviews or get pricing information.

Millennials Trust UGC

bazaarvoice-millennials-ugc.jpgAbout 51 percent of Millennials (born between roughly 1977 and 1995, by some estimates) say that recommendations from strangers through user-generated content on a company website are most likely to influence their opinion when making a purchase, compared to 49 percent who say that recommendations from friends and family is most influential, according to Bazaarvoice.

In contrast, Boomers (born between roughly 1946 and 1964, by some estimates) are almost twice as likely to favor recommendations from friends and family over user-generated content.

Some 66 percent of "Boomer" respondents say friends and family are influential when consumers are weighing purchases, compared to 34 percent who say recommendations from people they don't know are favored. Millennial Trust in UGC High


Yahoo Goes "Mobile First"

You can add Yahoo to the list of companies that have said their business strategy is "mobile first." Google executives have been saying that company's strategy is "mobile first" for some time. Most leading telecom service providers have been "mobile first," in terms of revenue, for some time as well.

Now Yahoo says "we’re moving forward with a 'mobile first' mindset."  Mobile first is simply a response to where revenue opportunities and growth now exist.


For Google, mobile first means new applications and initiatives are centered on mobile devices rather than PCs, mobile Internet rather than PC access to the Internet, and the mobile context instead of PC context.

That's why Android, Motorola Mobility and Google Wallet are associated with Google, where it might not have made so much sense in the past.


Inc. 500 Firm Blogging Down, Other Social Media Up?


For the first time since 2007, Inc. 500 firms seem to be blogging less, and shifting support to other forms of social media.

In 2010 half of the Inc. 500 had a corporate blog, up from 45 percent in 2009 and 39 percent in 2008.

In the 2011 study, the use of blogging dropped to 37 percent. The caveat is that the composition of firms in the Inc. 500 also has changed, and that makes a difference.

Companies in the advertising and marketing industry are most likely to blog, while companies in government services and construction make very little use of blogging. Still, it might be fair to note that firms across verticals are focusing more attention on Facebook and Twitter.

The platform most used by the 2011 Inc. 500 is Facebook, with 74 percent of companies using it.  But 73 percent use LinkedIn. About 25 percent of respondents said Facebook was the most effective social networking tool, while 24 percent said LinkedIn was the single most effective social networking platform.

Some 13 percent to 15 percent of respondents use text messaging, downloadable mobile applications and Foursquare.


Businesses do not use social media at the same levels. Since 2007, for example, studies by the University of Massachusetts have found significant differences between enterprise and smaller business use of blogging, for example.

In 2007, Inc. 500 firms were much more active users of blogging than enterprises were. At that time, eight percent of the Fortune 500 companies were blogging compared to 19 percent of the Inc. 500.

In 2008, 16 percent of the Fortune 500 used blogs, compared to 39 percent of the Inc. 500. The trend also held in 2009, with the Inc. 500 blogging at a rate of 45 percent, while the Fortune 500 had 22 percent of its list with corporate blogs. In 2010, half of the Inc. 500 were blogging, compared to 23 percent of the Fortune 500. 2011 Inc 500 Social Media

That seems to have changed in 2011. The latest study suggests use of blogging may have peaked as a primary social media tool in the U.S. business community, as adoption of blogging is declining for the first time since 2007 among the Inc. 500. The composition of the Inc. 500 has changed since 2007.


There has been an increase in companies providing "government services" and These companies are less likely to use certain social media tools, researchers suggest. It is unclear how much the changing composition of Inc. 500 firms affected the most recent findings.